How can we help?
Outcome Measures
- To access the measurement tool, open the Patient Chart, navigate to Documents, and select “Outcome Measure”.
- This section allows you to manage patient assessments and track outcomes over time.
- The Measurement Tool provides a centralized view of all assigned assessments, helping providers monitor patient progress and identify risk levels effectively.
Viewing Assessments
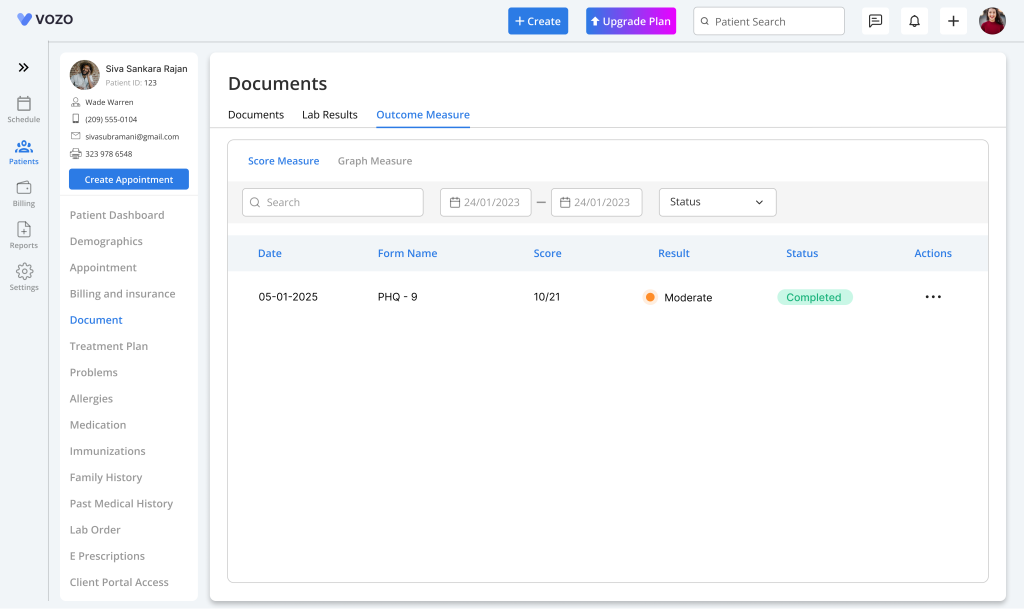
- In the default list view, you will see all assessments assigned to the patient. Each row displays key details such as Assessment Name, Date, Score, Status (Pending or Completed), and a colour flag indicating risk level.
- This view helps quickly identify completed assessments, pending tasks, and patients requiring attention based on severity.
Assigning an Assessment
- To assign a new assessment, click on the Documents tab and select the Send Intake Forms button. The user can choose either a single assessment or multiple assessments based on the requirement.
- After selection, click “Send” to assign the assessments to the patient. The status will be marked as Pending until completed.
- Each assessment has a status to indicate progress. Pending means the patient has not completed the assessment, while Completed indicates that responses have been submitted.
Patient Completing Assessments
- Patients can complete assigned assessments by logging into the Patient Portal, navigating to Documents, and opening the assigned assessment.
- After answering all questions, the patient clicks “Submit”, and the system automatically updates the status and calculates the score.
Manual Completion by Staff
- If needed, staff can complete an assessment on behalf of the patient by selecting “Complete Assessment” from the Measurement Tool.
- After entering responses and saving, the system automatically calculates the score and updates the status to Completed.
Viewing Assessment Details
- Click on any assessment to view detailed information, including individual responses, total score, severity level, and a trend chart.
- This detailed view provides deeper insights into patient condition and supports clinical evaluation.
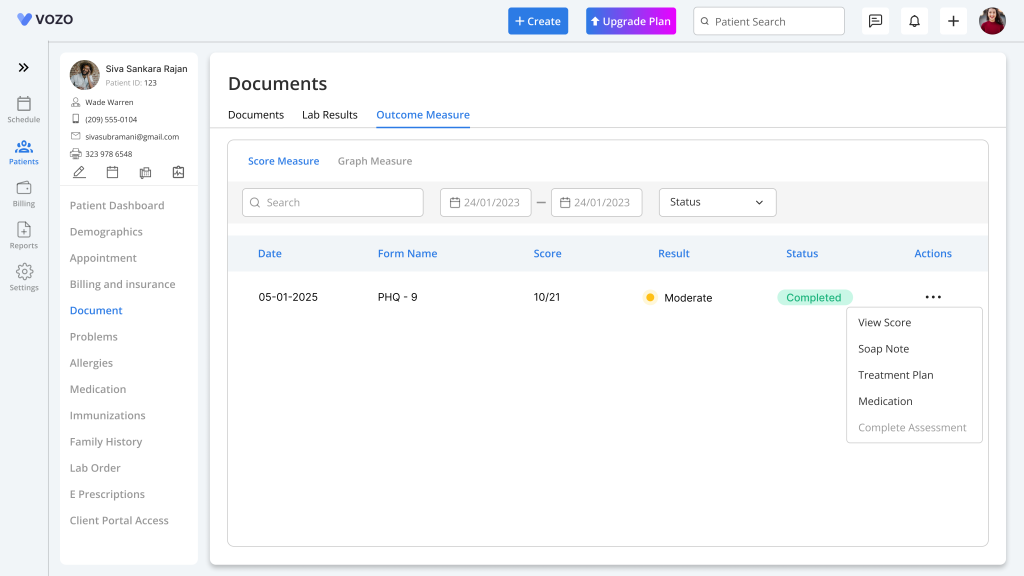
- From the Action column, you can perform multiple operations such as viewing scores, adding notes, creating treatment plans, adding medications, or completing assessments.
Scores & Risk Flags
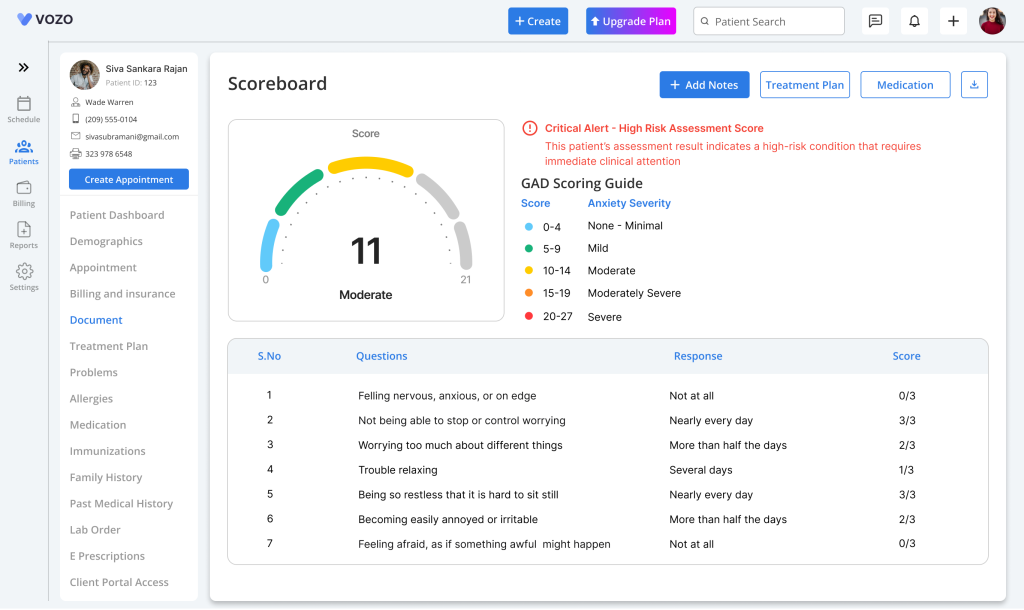
- Assessment scores are calculated automatically based on responses, and each assessment is assigned a severity level.
- Risk is visually indicated using color flags:
- Green → Low
- Yellow → Moderate
- Red → High
Switch to Graph View
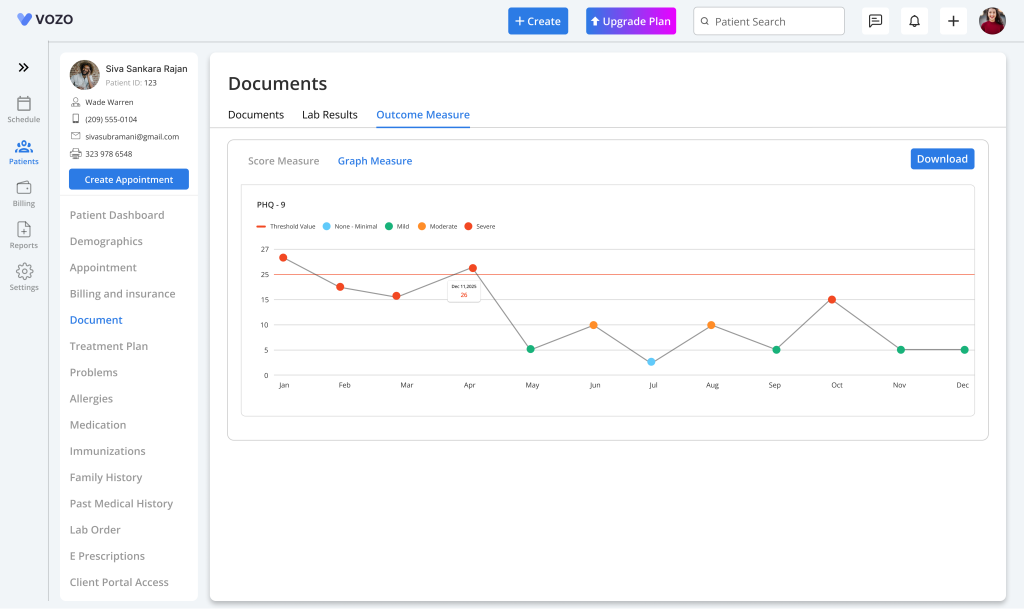
- Click on the “Graph Measure” Tab to view assessment data in a visual format. This view displays monthly trends for all assessments.
- The graph helps track patient progress over time and supports better clinical decision-making by highlighting patterns and changes.
Alerts & Notifications
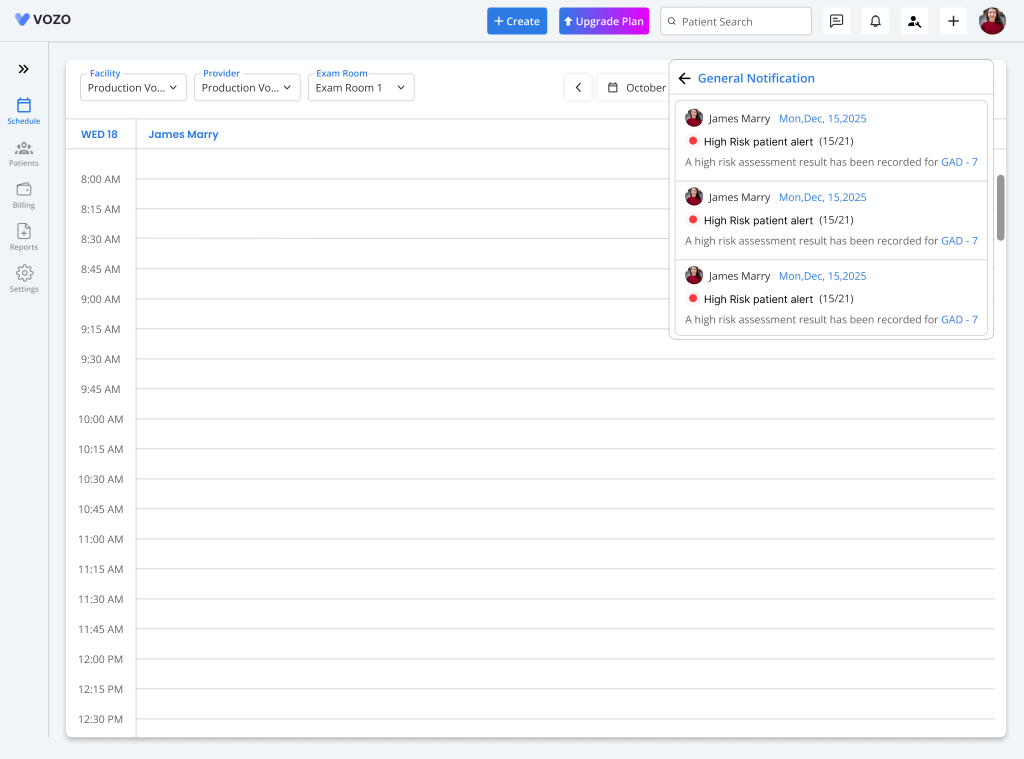
- The system generates alerts for high-risk responses, such as suicide risk or severe pain scores, ensuring timely attention.
- When an alert is triggered, a notification is sent to the provider with details like Patient Name, Date, Score, and alert message.
- Clicking the notification redirects you directly to the assessment details for quick action.
Tracking Patient Progress
- Use the Graph view to monitor trends across various assessments such as depression, anxiety, pain, and others.
- This helps in evaluating improvement, identifying concerns, and adjusting treatment plans accordingly for better patient outcomes.