How can we help?
Patient Dashboard
- Click Patient list > Select a Patient > Patient Dashboard menu.
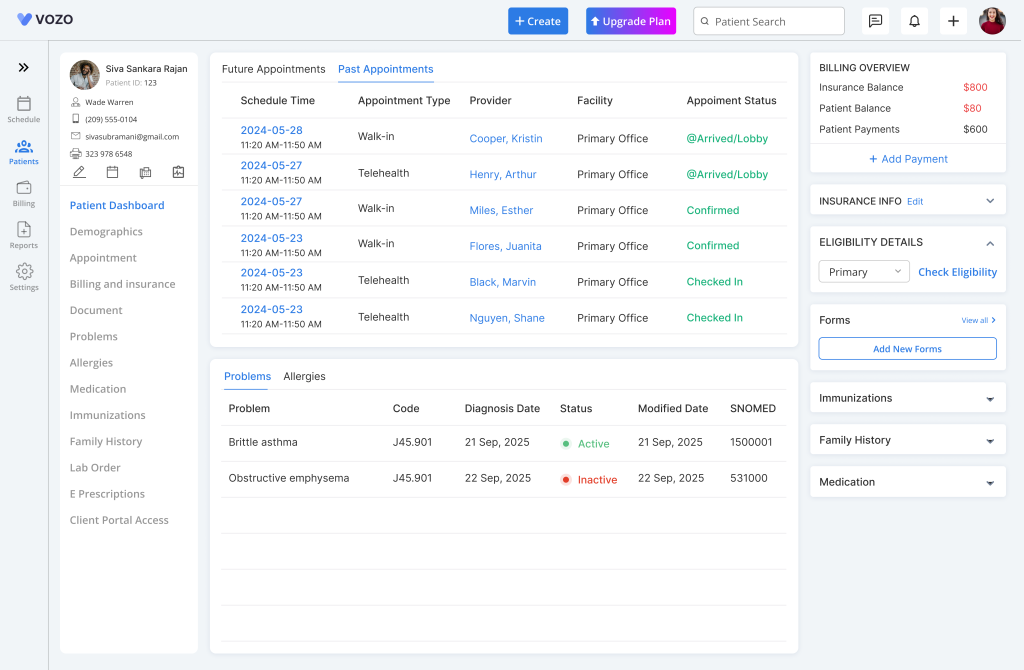
- View the overview of patient information details like:
- Future & Past Appointments
- Problems
- Allergies
- Billing Overview
- Insurance Info
- Eligibility Verification
- Forms
- Immunization
- Family History
- Medication
- From the Patient Dashboard, providers can Edit Profile, Schedule Appointment, Fax Demographics, View Vitals by clicking on the icons from the left patient submenu nav bar.
- And can also Add Payments, Check Eligibility, and Add Non-clinical forms & assessments from the Billing Overview, Eligibility Details, Forms section card.
Vitals Management
- Click “Appointment Details” to record patient vitals during a visit.
- When vitals are entered, the system automatically saves the data and updates the Patient Dashboard instantly without requiring any manual refresh.
- The Vitals section in the Patient Dashboard displays the most recent measurements such as Blood Pressure, Temperature, and Pulse along with the recorded date and time.
- From the Vitals section, you can choose to view the data using:
View List
View Graph
View List – Vital Records
- Click “View List” to access detailed vital records.
- The system displays up to the most recent 30 entries, where each record includes the date and time of measurement.
- In the list view, you can filter records by date, edit records, print records, or switch to the graph view for visual analysis.
Filter Vitals by Date
- To filter records, select a Start Date and End Date.
- The system displays only the vital records within the selected date range.
Edit Vital Records
- Click “Edit” next to a vital record to make changes.
- Update the required values and click “Save” to apply the changes, which are immediately reflected in the system.
Print Vital Records
- Click “Print” next to the required record to generate a hard copy.
- A print preview window will open where you can select printer settings and confirm the print action.
View Graph – Visual Representation
- Click “View Graph” to visualize vitals in a chart format.
- Each vital is displayed in a separate graph, allowing you to track patient health trends and observe changes over time.
View Values in Graph
- Hover over or click on any point in the graph to view the exact measurement.
- The system displays the vital value along with the corresponding date and time for better understanding of patient progress.